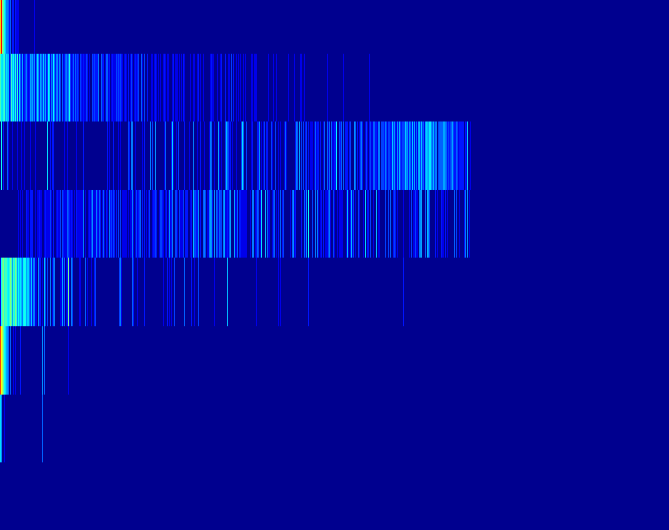
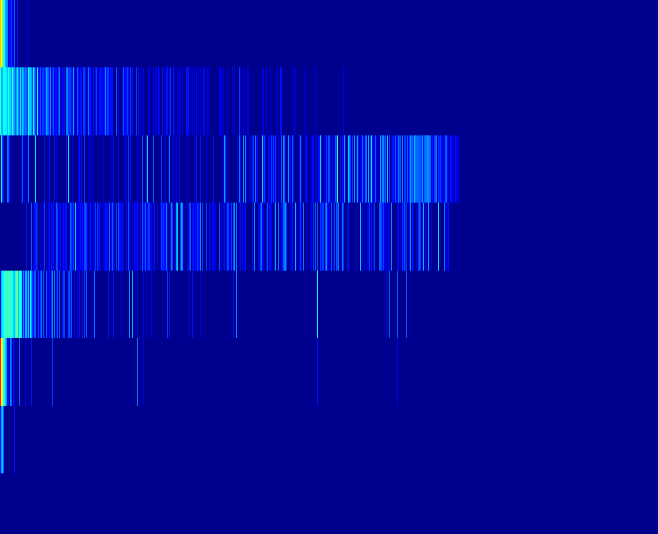
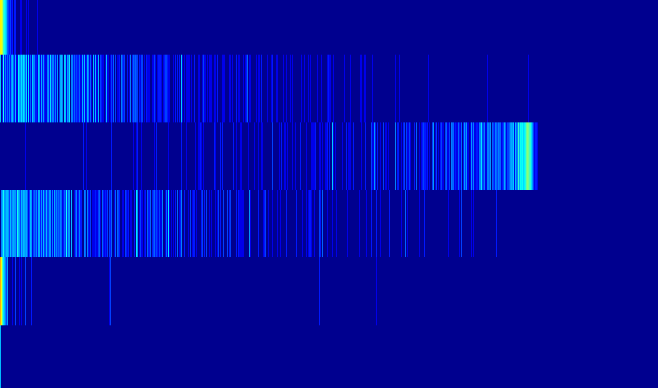
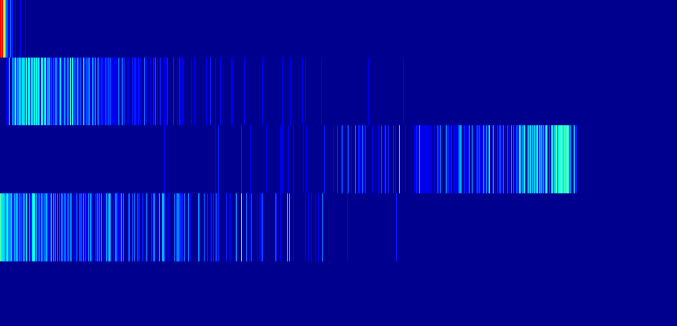
For any network, a unique portrait can be drawn as a generalization of the degree distribution (Bagrow et al, 2007). A matrix or table of values is first constructed by analyzing the l-shells (vertices at distance l) for each vertex. Each row of the table shows a different shell, with the nth table column showing the number of vertices with n other vertices at distance l. The table can be visualized in Netzcope, showing the values of the table entries by color.
The l-shell portraits have several advantages. The portrait is quickly calculated, and insensitive to the ordering of the vertices. Different types of networks, such as classical random graphs or small world networks, show distinct patterns in their portraits. Taken together, the portraits thus allow a quick visual classification of networks into general types. Some example portraits:
Additionally, the differences between two networks can be assessed by comparing the corresponding matrices describing the portraits. For example, the organizations projection of FP3 has a similar portrait with different revisions of the source data, but the portraits are quite different from Molloy-Reed models of FP3 or from other FP networks:
| Molloy-Reed Model (additive correlations, FP3 degree distribution) | |||||
| 291.37 | Molloy-Reed Model (multiplicative correlations, FP3 degree distribution) | ||||
| 1183.37 | 1023.45 | FP3 version 4 | |||
| 1101.35 | 941.31 | 79.84 | FP3 version 3 | ||
| 1745.78 | 1699.22 | 1643.50 | 1635.64 | FP5 v. 4 | |